อินโฟกราฟิก
รวบรวมข้อมูลสรุปสาระสำคัญ องค์ความรู้ นวัตกรรม และแนวทางการพัฒนาเมืองแห่งการเรียนรู้ในรูปแบบภาพที่เข้าใจง่าย
ค้นหาอินโฟกราฟิกที่คุณสนใจ
ผลการค้นหา: หมวดหมู่ [ระบบนิเวศการเรียนรู้] (พบ 3 รายการ)
ล้างการค้นหา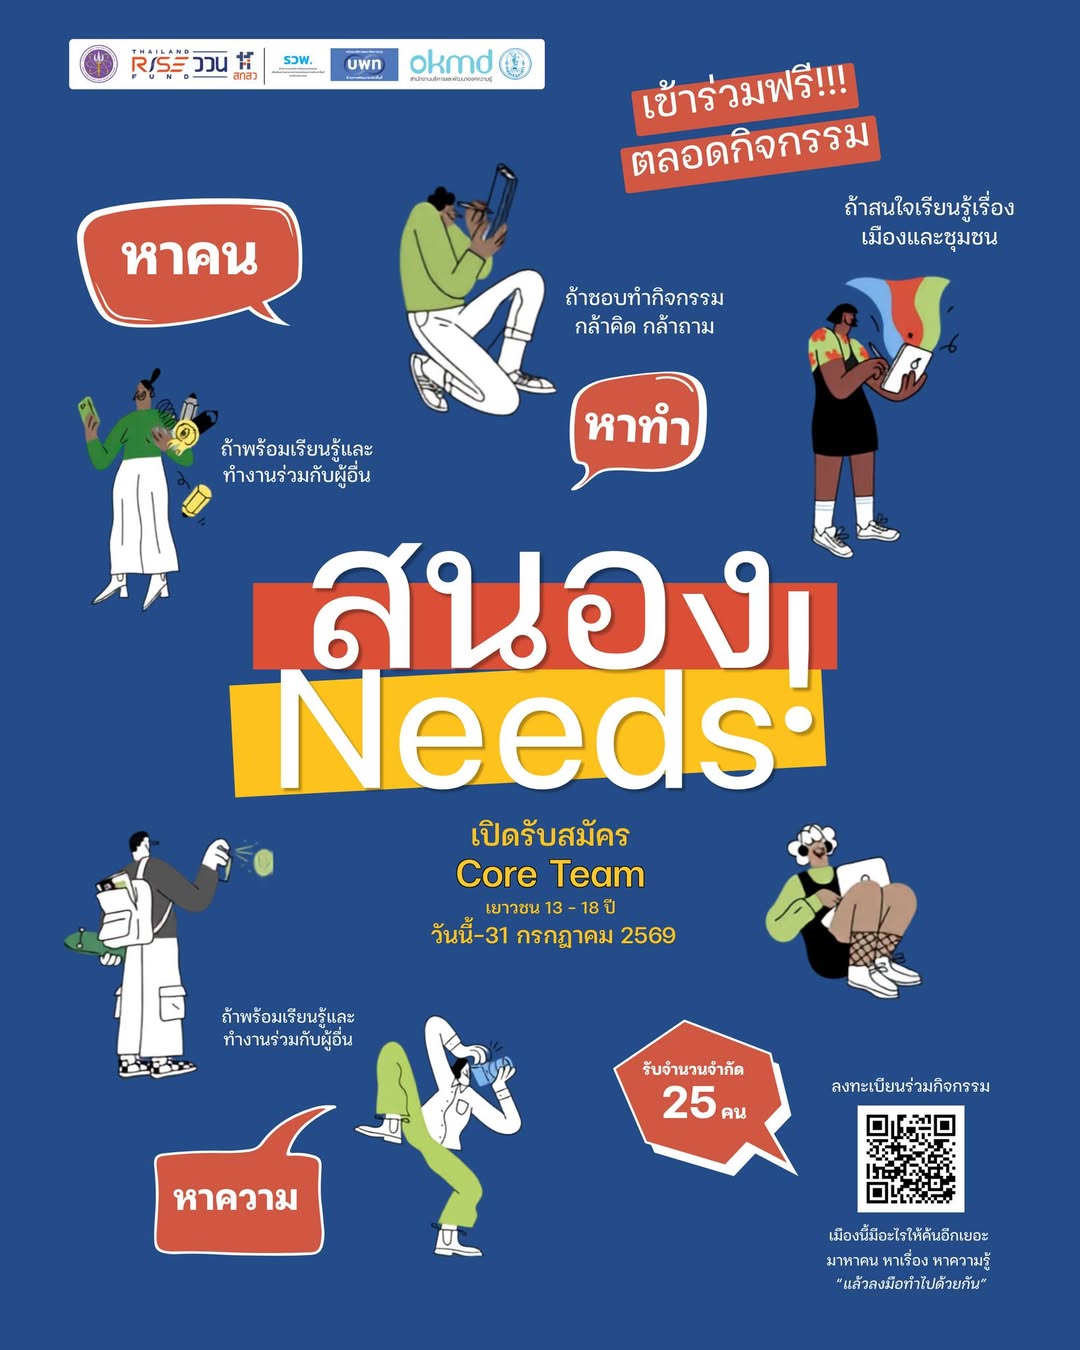
กิจกรรม Intro day สนอง Needs
มุ่งเน้นการเปิดพื้นที่ให้คนรุ่นใหม่ได้มีส่วนร่วมในการพัฒนาเมืองด้วยแนวคิด “หาคน หาทำ หาความ แล้วลงมือทำไปด้วยกัน!
เทศบาลนครตรัง
คณะทำงานขับเคลื่อน
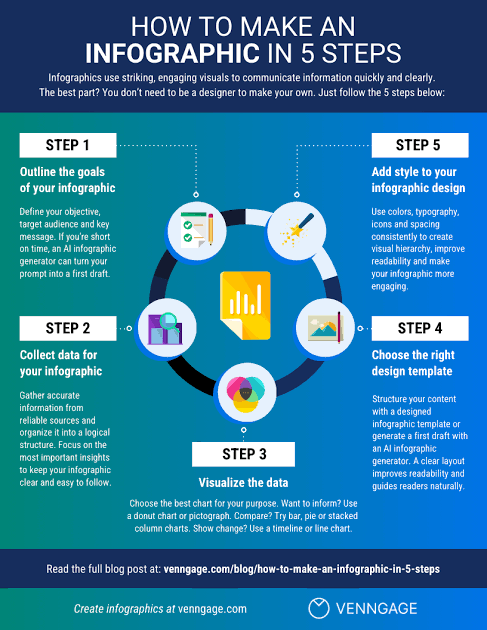
How to Make an Infographic in 5 Steps (2026 Guide)
TL;DR To make an infographic, follow these five steps: 1. Define your goal. Identify your audience, the problem you’re solving, and the 3-5 questions your infographic needs to answer. 2. Collect your data. Pull from your own research or public sources like Statista, Kaggle, or data.gov, then organize it around your key questions. 3. Choose the right charts. Match each data point to a chart type based on whether you want to inform, compare, show change, organize, reveal relationships, or explore. 4. Build the layout. Pick a Venngage infographic template or use Venngage’s AI Infographic Generator to create one from a text prompt. Choose a single-column layout for a process, two columns for a comparison, or a multi-section layout for dense data. 5. Refine the design. Tighten the copy, add icons for visual rhythm, use negative space to group elements, and apply color to highlight what matters most.
กรุงเทพมหานคร

ระบบนิเวศการเรียนรู้ตลอดชีวิต (Lifelong Learning Ecosystem) สำหรับทุกช่วงวัย
อินโฟกราฟิกสรุปภาพรวมการเชื่อมโยงระบบการเรียนรู้ในระบบ นอกระบบ และตามอัธยาศัย ผสานนวัตกรรมดิจิทัลเพื่อพัฒนาทักษะอาชีพและคุณภาพชีวิตประชาชน
ภาพรวมประเทศ
สำนักงานบริหารและพัฒนาองค์ความรู้ (OKMD)