How to Make an Infographic in 5 Steps (2026 Guide)
คำอธิบายและรายละเอียด
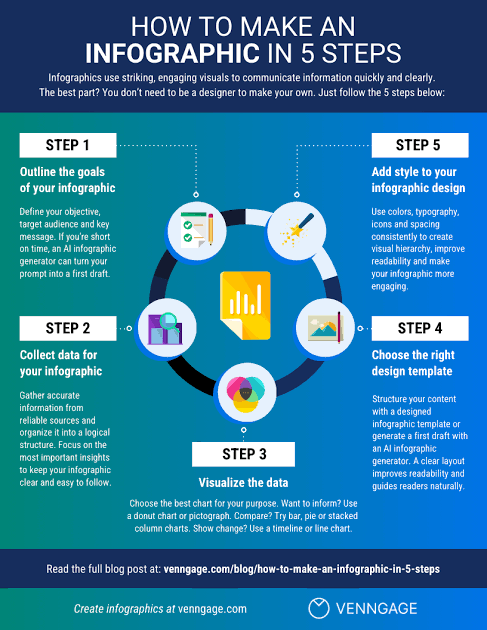
TL;DR To make an infographic, follow these five steps: 1. Define your goal. Identify your audience, the problem you’re solving, and the 3-5 questions your infographic needs to answer. 2. Collect your data. Pull from your own research or public sources like Statista, Kaggle, or data.gov, then organize it around your key questions. 3. Choose the right charts. Match each data point to a chart type based on whether you want to inform, compare, show change, organize, reveal relationships, or explore. 4. Build the layout. Pick a Venngage infographic template or use Venngage’s AI Infographic Generator to create one from a text prompt. Choose a single-column layout for a process, two columns for a comparison, or a multi-section layout for dense data. 5. Refine the design. Tighten the copy, add icons for visual rhythm, use negative space to group elements, and apply color to highlight what matters most.